Introduction: Why Windows Diagnostic Tools Are a Game-Changer for Everyday Users
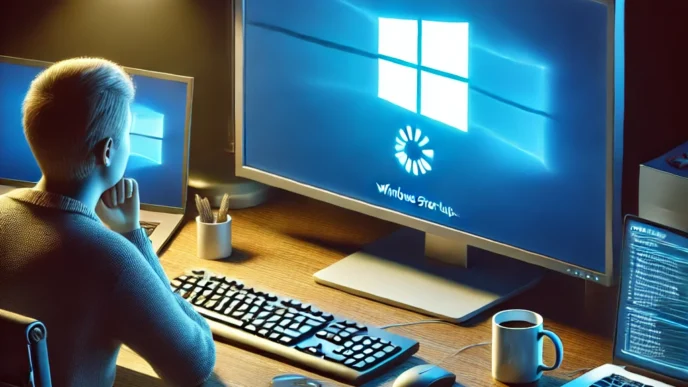
You’re working on something important, and suddenly your computer freezes. Or maybe it’s been taking forever to boot up. These issues can cause frustration, lost time, and anxiety about potential hardware failure. Fortunately, Windows offers powerful diagnostic tools built right into the system—but many users have never used them.
The good news is you don’t have to be an expert to take control of your computer’s health. Whether you’re dealing with frequent crashes, sluggish performance, or unexplained errors, these tools help identify root causes without additional downloads or professional intervention.
In this guide, we’ll walk you through how to access and use these built-in diagnostics step by step. You’ll learn how to monitor memory, system performance, application stability, and hardware resources—and more importantly, how to interpret the results. By understanding how these tools work, you can make smarter decisions about when to fix, upgrade, or seek help.
📊 According to 2024 surveys, over 60% of users experiencing slowdowns or crashes had never used built-in Windows diagnostics—highlighting a major missed opportunity for prevention.
What Are Windows Diagnostic Tools—and Why Should You Use Them?
When your PC starts acting up, it can be hard to know whether the issue lies in hardware, software, or somewhere in between. Windows diagnostic tools provide structured insight into how your computer is functioning. From monitoring live performance to testing memory or reviewing historical crashes, these tools help users pinpoint the source of problems.
Diagnostics fall into three main categories:
- Monitoring tools help track system usage in real-time.
- Testing tools check for issues like faulty memory or corrupted files.
- Log and analysis tools help identify patterns in crashes, errors, or failures.
These tools are particularly valuable because they’re built into Windows, eliminating the need for additional software. And unlike guesswork or repeated restarts, diagnostics provide actionable data.
📌 Real-World Example: One user assumed malware was slowing their PC. A performance monitor revealed that a background update service was using 80% of CPU—a simple setting adjustment solved the issue.
Using the Windows Memory Diagnostic Tool for RAM Issues
Unexplained crashes, random restarts, or blue screens of death (BSODs) often point to memory issues. The Windows Memory Diagnostic Tool is designed to check your system’s RAM for errors that could be causing these symptoms.
How to Use It:
- Save all your work and close programs.
- Access the diagnostic tool by typing a generic term like “memory test” in the system search.
- Choose to restart your computer and run the test.
- During reboot, the diagnostic will run automatically.
- After restarting, results will be available in the Event Viewer.
Symptoms That Suggest a Memory Problem:
- Frequent crashes or restarts
- Applications closing unexpectedly
- Long load times for basic tasks
📝 Mini Scenario: A user’s laptop crashed every time they opened multiple apps. The memory test revealed one failing RAM stick, which was then replaced, solving the issue.
📌 Why It Matters: RAM issues can mimic many other problems. Testing memory early can prevent time-consuming troubleshooting later.
How to Use Performance Monitor to Analyze System Health
Performance Monitor is a comprehensive tool for assessing how your system is functioning over time. It allows users to track resource usage and spot potential bottlenecks.
How to Use It:
- Open the monitor by typing a generic keyword like “performance monitor.”
- View real-time statistics on CPU, disk, and memory usage.
- Create a custom data set to track performance over time (optional).
- Analyze metrics during normal use and during issues.
📊 Key Metrics to Watch:
| Metric to Watch 🖥️ | Normal Range | What’s Concerning |
|---|---|---|
| CPU Usage | 10–40% | 80%+ consistently |
| Disk Queue Length | <1 | >2 regularly |
| Memory Used | <70% | >85% regularly |
📌 Why It Matters: These metrics can reveal issues like overloaded memory or background processes that slow down your PC—long before they become system-breaking.
Tracking System Reliability with Reliability Monitor
The Reliability Monitor provides a timeline of your system’s stability, making it easy to track down the cause of crashes, failed updates, or app errors.
How to Access:
- Search for “reliability monitor” or access via system tools.
- View the stability index, which ranges from 1 (unstable) to 10 (stable).
- Examine red and yellow icons that indicate errors or warnings.
What to Look For:
- Repeated application crashes
- Frequent system reboots or hardware errors
- Correlation between errors and recent software installs
📝 Case Example: A user experienced periodic system crashes. Reliability Monitor showed that each crash followed an automatic software update. After disabling the auto-update feature, the system stabilized.
💡 Take This With You: Patterns in the reliability timeline often point to the root of recurring issues.
Checking Detailed Logs in Event Viewer for Deeper Issues
Event Viewer is the most technical but also one of the most informative tools in Windows diagnostics. It records every significant system event, making it invaluable for tracing complex issues.
How to Use It:
- Search for “event viewer” and open the tool.
- Navigate to Windows Logs > System.
- Sort entries by date and filter for errors and warnings.
What You’ll Find:
- Critical system errors (marked in red)
- Warnings about potential failures
- Information about service starts, hardware detection, and crashes
📋 Mini Checklist:
- Open Event Viewer
- Navigate to Windows Logs > System
- Look for red icons around the time of the issue
- Review the details for event ID and description
💡 Take This With You: Most persistent system issues leave a digital breadcrumb trail—Event Viewer helps you follow it.
Resource Monitor—Real-Time Tracking of PC Resource Usage
If you want to see what your computer is doing right now, Resource Monitor is your go-to tool. It lets you track how much CPU, memory, disk, and network your apps are using in real time.
How to Use It:
- Search for “resource monitor.”
- Choose a tab: CPU, Memory, Disk, or Network.
- Sort processes to find what’s using the most resources.
📊 Optional Table:
| Resource | High Usage Symptom | Possible Cause |
|---|---|---|
| CPU | System lag, fan noise | Background update, stuck app |
| Memory | Slow multitasking | Too many apps, memory leak |
| Disk | Slow file access | Syncing, drive issue |
| Network | Slow browsing | Background downloads |
📝 Use Case: A user’s PC slowed dramatically every evening. Resource Monitor revealed a scheduled sync process consuming disk bandwidth—rescheduling it solved the problem.
🔁 Putting It All Together: This tool is ideal for identifying real-time slowdowns and isolating the apps or services behind them.
How to Interpret Results Without Getting Overwhelmed
Running diagnostic tools is only half the equation—the real value comes from knowing what the results mean. Don’t worry: you don’t need to understand every detail to get useful insights.
Key Principles:
- Look for patterns: One error may be a fluke. Multiple errors at the same time point to a real issue.
- Context matters: A red alert is not always serious. It could be a minor event or a one-time problem.
- Cross-check tools: If Performance Monitor, Reliability Monitor, and Event Viewer all highlight the same issue, it’s likely valid.
- Watch timing: Was there a new install, update, or setting change right before the problem began?
💡 Helpful Insight: Think of diagnostics like reading your car dashboard. A warning light doesn’t mean you’re doomed—just that it’s time to look under the hood.
Diagnostic Routine Checklist – When and How Often to Use These Tools
Just like regular oil changes prevent car trouble, periodic system checks can prevent PC breakdowns. Here’s when to run diagnostics and why:
📋 Routine Table:
| Tool | When to Use | Purpose |
|---|---|---|
| Memory Diagnostic | After crashes or freezing | Check for bad RAM |
| Performance Monitor | Ongoing lag or slowdown | Identify system bottlenecks |
| Reliability Monitor | After crashes or failed apps | Spot patterns in failures |
| Event Viewer | After BSOD or boot failure | View detailed error logs |
| Resource Monitor | Real-time troubleshooting | Monitor resource-intensive apps |
📌 Why It Matters: Regular use of these tools helps you stay ahead of issues, protecting your data and productivity.
FAQ – Windows Diagnostic Tools for Beginners
Can using these tools damage my PC?
No. These are read-only tools. They monitor and report—they don’t change anything unless you take action.
What should I do if I find an error?
Start by researching the error code and using Windows troubleshooting tips. Often, small issues can be resolved with system settings or cleanup.
Do I need to run all tools every time?
Not at all. Use what’s relevant to your current issue. For example, use Memory Diagnostic for crashes, or Resource Monitor for real-time slowdowns.
What’s the difference between Performance Monitor and Resource Monitor?
Performance Monitor gives long-term, customizable tracking. Resource Monitor shows live usage and is easier for quick checks.
Is this better than downloading third-party software?
For most users, yes. Built-in tools are safer, reliable, and designed to work with your system directly.
🧠 Remember This: These tools were built to empower users. They’re safe, accessible, and incredibly informative when used correctly.
Conclusion: Diagnosing Problems Is Easier Than You Think
Slowdowns, crashes, or unexplained behavior don’t have to leave you in the dark. With the built-in Windows diagnostic tools covered in this guide, you can monitor, detect, and interpret system issues confidently—without spending a dime or needing a tech background.
Whether you’re checking memory, performance, or crash logs, using these tools regularly helps keep your system running efficiently and extends the life of your device.
📣 Bookmark this guide and refer back when your PC isn’t behaving right.
📣 Share it with a friend or colleague who thinks “Ctrl + Alt + Delete” is the only fix.
📌 Privacy Note: This article is for general informational purposes only. It does not collect personal data, and no professional services are being sold through this guide.


